Inflation Print Markets and the Detail That Decides Them
Which index, which vintage, which decimal. Inflation contracts are settled by details that most participants never read, and occasionally that matters.
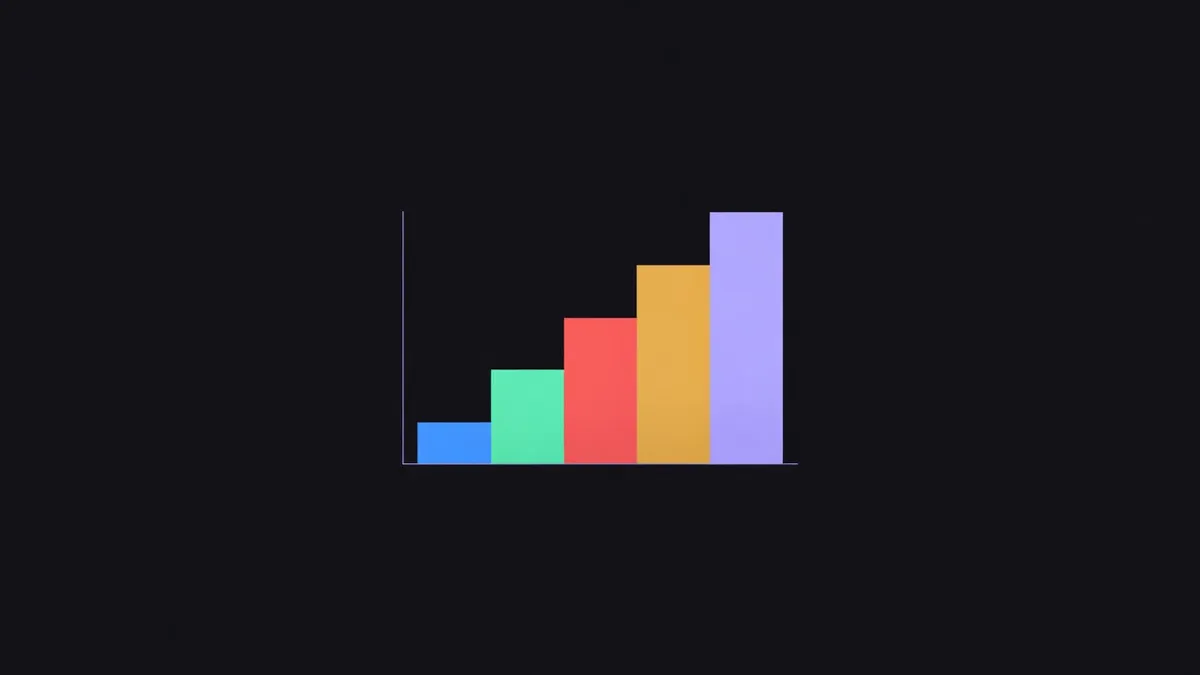
Inflation contracts look like bets on the economy. Mechanically they are bets on a specific number published by a specific agency at a specific moment, rounded to a specific number of decimal places.
The gap between those two descriptions is where people lose money.
Which index
"Inflation" is a family of measures, not one number. Headline and core. Different baskets. Month-on-month and year-on-year. Seasonally adjusted and not. Different agencies with different methodologies.
These move differently, sometimes substantially. A contract names exactly one, and if you were thinking about a different one, your forecast was about something else.
Which vintage
Contracts settle on the figure published at the named time. Later revisions do not reopen anything.
This is the right design for a contract and it means you are not trading "what inflation was". You are trading what a particular agency first said it was. Where settlement numbers come from.
Which decimal
Most inflation figures are published to one decimal place. Contracts are written around thresholds at that precision, which means exact ties at the strike happen regularly, not rarely.
A contract reading "above 3.0" with a print of exactly 3.0 resolves by a rule in the terms. Read the comparison operator before you assume. This is the single most common way an inflation contract surprises someone.

The strike ladder
Inflation releases are usually listed as a ladder of thresholds. This is the most useful form of the market, because it shows you a distribution rather than a point estimate.
Read the ladder and you can see where the market expects the number to land, how tight its expectations are, and whether it is skewed to one side. Compare that against published forecast surveys and your own view and you have a genuine forecasting exercise. How a contract is put together.
Behaviour around the print
The standard pattern for a scheduled release: widening spreads and thinning depth in the final minutes, an immediate reprice at publication, and a slower adjustment over the following hour as the detail is digested.
Related markets move too. A surprising inflation print moves rate expectations within seconds. Interest rate markets and macro release markets.
Cross-venue comparison here
This is the category where equivalence matters most and is hardest. Two venues can both list "inflation above 3%" and mean different indices, different vintages, different tie rules and different fallbacks if publication is delayed.
A price difference between two contracts on genuinely different indices is not a gap. It is two correct prices on two different questions, and trading it as a pair means holding two positions that can both lose.
This is precisely why this site grades comparability before reporting any difference, and why what it reports is a theoretical cross-market edge rather than an expected return. Equivalence grades and resolution differences.
Reading them well
Start from the published forecast consensus as your base rate. Adjust for anything you know about the components. Compare against the ladder. Note where you disagree and why. Score yourself later.
That is a good use of this category whether or not you ever trade it. Base rates first.
Next
Sports event contracts and why they are the most contested category.
Educational content only. Nothing here is financial advice, a solicitation, or an offer to trade. Prediction markets can move against you and a position can lose its entire value. Where this guide describes a difference between venues it describes a theoretical cross-market edge in observed prices, which is not a profit: fees, spreads, capital lockup, transfer time and differing settlement rules all come out of it first.
Keep reading
 What Markets Price · 3 min readInterest Rate Markets and Why They Are Well PricedRate decision contracts compete with an enormous existing futures market. That competition makes them among the most reliable prices on any event venue.
 What Markets Price · 3 min readSports Event Contracts and Why They Are ContestedEvent contracts on sport sit on a regulatory boundary and compete with the most efficient betting markets in existence. Both facts shape how they trade.
 What Markets Price · 3 min readHow Election Markets Work, MechanicallyThe structure of political event contracts: what resolves them, why venues disagree, and how to read a political price without reading politics into it.
 Risk and Costs · 3 min readThe Limits of Any Measured EdgeA measured price difference is a measurement. The distance between that and a return is made of costs, capacity, decay and the chance the measurement is wrong.