How to Read a Prediction Market Page
Price, volume, open interest, the book and the history. What each number on a market page is telling you, and which ones deserve your attention first.
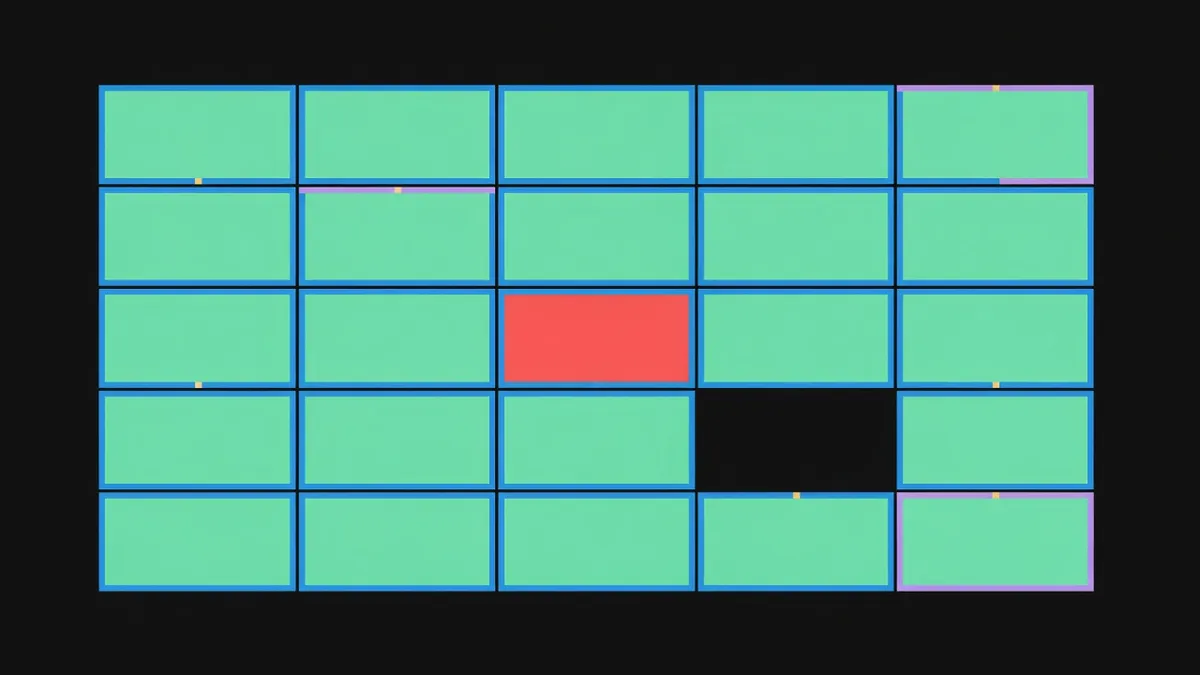
A market page throws a lot at you: a headline probability, a chart, volume, open interest, an order book, a rules section, sometimes a comment stream. Here is what each of those is for, in the order you should actually look at them.
First: the rule, not the price
Before the number means anything, you need to know what question it answers. The rules section — sometimes called resolution criteria, sometimes settlement terms — tells you the exact condition, the source that decides it, and the date.
This sounds like a formality and it is not. A market titled "Will inflation exceed 3%?" might mean year-over-year CPI, or core CPI, or the PCE index, measured for a particular month, as first published or as revised. Those can point in different directions at the same time. Read it once, properly, and you will avoid the most expensive category of mistake in this whole field. Resolution, explained covers what to look for.
Second: the price, and which price
You will usually see several numbers that all claim to be the price.
Last trade is what somebody actually paid, whenever that was. On a busy market it is seconds old; on a quiet one it can be from last Tuesday.
Best bid and best offer are the highest price someone will pay and the lowest price someone will accept right now. These are live.
Mid is the average of the two, and it is usually the fairest single summary of where the market is.
When a quiet market shows a last trade of 40 and a book of 30 bid, 48 offered, the honest answer to "what is the probability" is "somewhere around 39, with a lot of uncertainty and an 18-point spread you would have to cross". Mid price, last trade and which one is the market is worth reading before you quote any number to anybody.
Third: is there anybody here
Two numbers answer this, and they are not the same.
Volume is how much has traded, usually over the market's life or a rolling window. It measures activity.
Open interest is how many contracts are currently outstanding — positions that exist right now and have not been closed or settled. It measures commitment.
A market can have large volume and small open interest, which means people are trading in and out rather than holding. It can have large open interest and almost no recent volume, which means positions were established and everybody is now waiting. Both are informative and neither is better. Volume and open interest are different signals unpacks the cases.
If both are small, treat the price as one person's opinion with a spread around it.

Fourth: the book
The order book lists the resting bids and offers at each price with the size available. It answers the question the headline price cannot: how much can I actually do here?
A market showing 62 bid and 63 offered looks tight. If there are 40 contracts on each side and you want 500, it is not tight for you — you will walk up the book and pay materially more than 63 for the later part of your order. Depth, slippage and the price you actually get works through the arithmetic with numbers.
Fifth: the history
A price chart tells you where the market has been. Three things are worth taking from it.
The level relative to its own range. A market at 62 that has spent a month between 58 and 66 is unremarkable. The same 62 after a month at 20 is a different situation.
Whether moves were gradual or stepped. Steps usually mean news. Gradual drift usually means positioning or a slow accumulation of evidence. Knowing which you are looking at tells you whether to go and find the news.
How much it moves normally. A market that routinely swings six points in a day has not told you anything by moving six points today. Telling a significant move from noise is the whole subject, and it is the basis of how this site's movers board ranks anything.
What to ignore, mostly
Comment streams are entertainment and occasionally a source of genuine information about resolution edge cases, which is the only reason to read them.
Percentage-change figures on small prices are usually meaningless. A market moving from 2 cents to 3 cents is "up 50%", which is technically true and communicates nothing useful. Work in percentage points instead. The distinction matters more than it sounds.
"Trending" and "hot" labels tell you about attention, not about opportunity, and attention is usually the thing already reflected in the price.
A two-minute routine
- Read the resolution rule and the settlement date.
- Check the best bid and offer, and add Yes and No together to confirm they sum near a dollar.
- Look at volume and open interest to decide whether the price is a market or an opinion.
- Look at the book at the size you care about.
- Only then look at the chart.
Doing it in that order stops the chart from framing your view before you know what you are looking at.
Next
Who is on the other side of your trade explains where the liquidity you just examined actually comes from.
Educational content only. Nothing here is financial advice, a solicitation, or an offer to trade. Prediction markets can move against you and a position can lose its entire value. Where this guide describes a difference between venues it describes a theoretical cross-market edge in observed prices, which is not a profit: fees, spreads, capital lockup, transfer time and differing settlement rules all come out of it first.
Keep reading
 Prediction Market Basics · 3 min readPrediction Markets vs Sportsbooks: Odds, Vig and PriceA sportsbook sets a price and takes the other side. An exchange matches you against other participants. That structural difference shows up in every number on screen.
 Prediction Market Basics · 3 min readWho Is on the Other Side of Your TradeSomebody took the opposite view, or was paid to be indifferent. Knowing which one you are dealing with changes how you read a price and a spread.
 Prediction Market Basics · 4 min readPrediction Markets vs Polls: What Each One MeasuresPolls measure stated intention in a sample. Markets measure what people will risk money on. They answer different questions, and each fails in its own way.
 Data and Automation · 3 min readHistorical Price Series and Their PeculiaritiesEvent contract history is not like equity history. Fixed bounds, a settlement point, irregular trading and a survivorship problem built into the data.