Telling a Significant Move From Noise
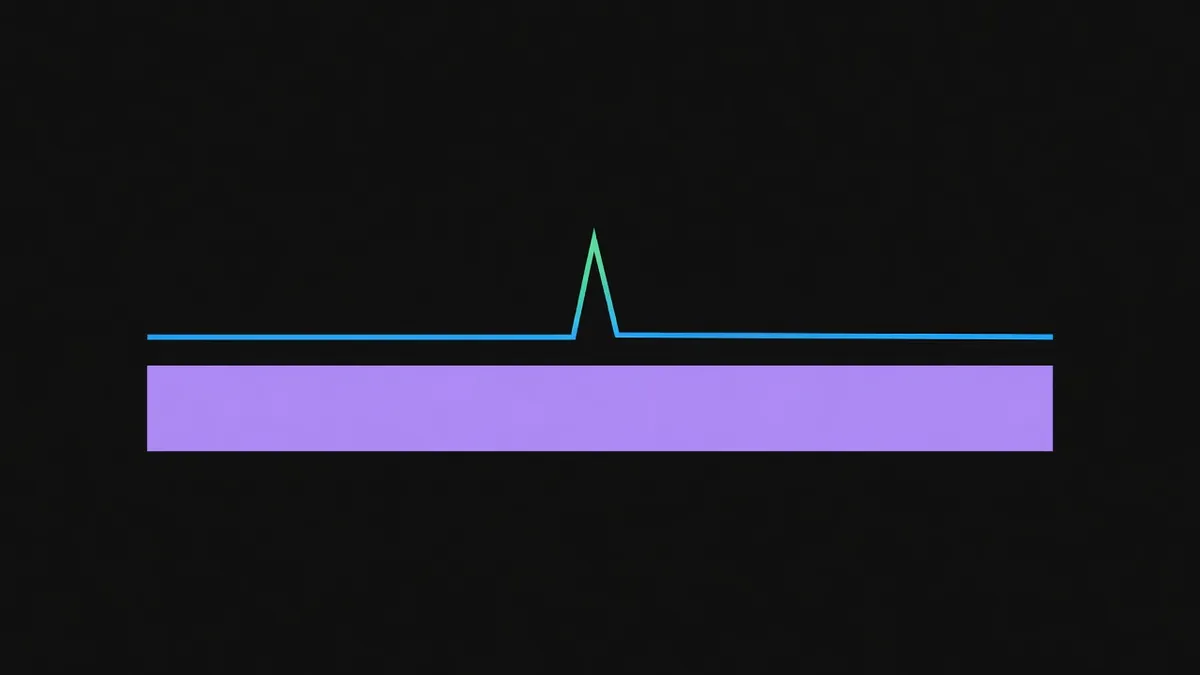
A five-point move means nothing on its own. Measured against a market's own normal variation and its volume, it either means something or it does not.
"Biggest movers" lists are the most-read and least-useful feature of most market sites, because they rank by raw change. Raw change measures volatility, and the most volatile markets are the ones you already knew were volatile.
Here is how to do it properly, and how this site does it.
The problem with raw points
Two markets both moved eight points today.
The first has traded between 44 and 52 all month, swinging several points most days. Eight points is a normal Tuesday.
The second has sat between 71 and 74 for three weeks and just moved to 66. Eight points is unprecedented for it.
Ranked by raw movement they tie. Ranked by meaning they are nowhere near each other.
Normalise by the market's own variation
The fix is to divide the move by a measure of the market's typical movement — its recent standard deviation, or its average absolute daily change, over a window long enough to be stable.
significance ≈ |move| ÷ typical move for this market
A move of two typical units is notable. Four is unusual. Anything beyond that is either genuine news or a data problem, and both are worth looking at.
This is the core of the ranking on the movers board: a three-point move in a quiet market can and does outrank a nine-point move in a noisy one.
Then check the volume
A large normalised move on no volume is usually a quote artefact, not a repricing. Either a market maker moved their quote, or a single small trade printed at an outlying price, or the book thinned and the mid drifted.
So significance needs a second dimension: was there money behind it?
a real move = unusual size + meaningful volume
Both conditions. Either alone produces false positives — large moves that are quote noise, or heavy volume that trades in a tight range and tells you the market is busy rather than changing its mind.
Volume and open interest are different signals matters here: volume with rising open interest is new positioning, and volume with flat open interest is churn.

Then check where in the range it happened
A two-point move from 96 to 98 is a much larger revision in odds terms than a two-point move from 48 to 50. If you are being careful, measure in log-odds rather than points, which makes equal steps correspond to equal amounts of evidence.
In practice, the shortcut is: give extra weight to moves near the extremes, and be sceptical of them at the same time, because that is also where tick size and fees distort things. Why prices near 1c and 99c behave differently is the tension in full.
Then check the neighbours
Real information usually moves more than one market.
If a market on a decision moves and the adjacent-month markets do not, be suspicious. If a market moves on one venue and the equivalent contract on the other venue does not, one of them is late or thin — and that is exactly the situation the gap board is built to surface.
If related markets all moved together, something happened in the world. That is the strongest confirmation available without leaving the data.
The four-question filter
For any move you are tempted to take seriously:
- How unusual is it for this market? Not how big in points.
- Did volume come with it? And did open interest rise?
- Where in the range did it happen? Extremes carry more evidence.
- Did anything else move? Related markets, the other venue.
A move that passes all four is worth reading about. A move that passes one is a market breathing.
What this site publishes
Every entry on the movers board carries the raw point change, the window, and a significance measure that is the point change scaled by the market's own recent variation. The default sort is significance, not size, because size is the question you can answer by looking.
Sorting by significance rather than by raw movement is the whole point: a four-point move on a market that normally moves half a point is a larger event than a fifteen-point move on one that swings constantly. Reading a probability change without overreacting is the habit that goes with it.
Next
That completes the pricing section. Why two venues price the same event differently is where these measurements get interesting.
Educational content only. Nothing here is financial advice, a solicitation, or an offer to trade. Prediction markets can move against you and a position can lose its entire value. Where this guide describes a difference between venues it describes a theoretical cross-market edge in observed prices, which is not a profit: fees, spreads, capital lockup, transfer time and differing settlement rules all come out of it first.
Keep reading
 Prices and Probability · 3 min readWhen the Outcomes Do Not Add to 100%A field of outcomes should sum to one dollar. When it sums to more, you are seeing the spread. When it sums to less, something is missing or stale.
 Prices and Probability · 4 min readWhy Prices Near 1c and 99c Behave DifferentlyThe extremes are their own world. Tick size, capital cost and fees mean a price of 2 cents is not simply a small probability, and should not be read as one.
 Prices and Probability · 3 min readMid Price, Last Trade and Which One Is the MarketThree numbers claim to be the price and they disagree. Which one to quote, which one to trade against, and how to tell when none of them is real.
 Kalshi · 3 min readOrder Types on Kalshi and When to Use EachLimit, market, resting and immediate. A short guide to expressing a view on an event exchange without paying more than the view is worth.