Reading a Probability Change Without Overreacting
Markets move constantly. Most of that movement is noise. Here is how to tell which changes carry information and which are just the spread breathing.
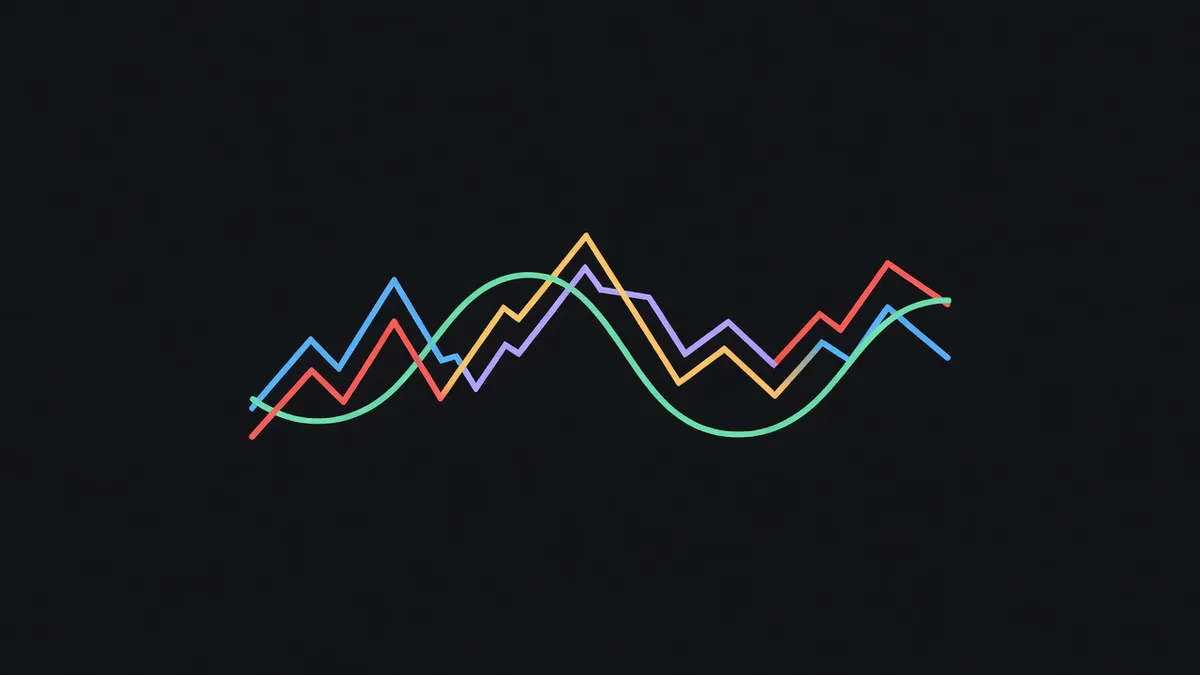
Open any market list sorted by movement and you will see double-digit changes. Most of them mean nothing. Sorting out which do is the difference between watching markets usefully and being led around by them.
A move has three components
Noise. The price oscillating within its normal range because trades arrive at the bid and the offer in some order. A market with a two-cent spread will show a two-cent "move" from trade to trade without anything having happened.
Drift. Slow, directional change as positions accumulate or as a slow stream of weak evidence arrives. Usually not newsworthy on any given day and quite informative over a week.
Information. A step change, usually fast, usually on volume, usually attributable to something specific.
The mistake is reading noise as information because it happened to be large in a market that is always large.
Normalise by the market's own volatility
Five points is enormous in a market that has spent a month between 71 and 74. Five points is a Tuesday in a market that swings ten points a day. Any ranking of "biggest movers" that ignores this is mostly a ranking of "most volatile markets", which you already knew.
The fix is to measure a move against the market's own recent variation rather than in absolute points. That is what significance means on this site's movers board: the ranking is by how unusual the move is for that market, not by how many points it covers. A three-point move in a stable market can outrank a nine-point move in a noisy one, and that is the correct behaviour.
Telling a significant move from noise goes through the method.
Normalise by where the price started
A move from 50 to 55 and a move from 90 to 95 are both five points and they are not equivalent. The second one is a much larger change in the odds: from 9-to-1 against to 19-to-1 against.
One way to see this is to think in terms of how much money the move is worth on a fixed stake. Another is to convert to log-odds, where equal steps correspond to equal amounts of evidence. You do not need the maths to hold the intuition: moves near the extremes carry more information than moves near the middle.
This also explains why markets look "sticky" at the extremes. It takes a great deal of evidence to move a price from 95 to 97, and very little to move one from 48 to 50.

Check whether the move is trades or quotes
A price can move because somebody traded, or because the resting quotes moved. The first means capital was committed. The second may mean nothing more than a market maker adjusting inventory or widening ahead of an event.
Volume alongside the move is the tell. A five-point move on 4,000 contracts is a different animal from a five-point move on 30. The trades board shows the largest individual prints, sized against each market's own typical trade, which is a reasonable proxy for "did somebody actually do something".
Ask what the move is consistent with
When a market moves, before reaching for an explanation, check whether related markets moved too.
If a market on a policy decision moves and the markets on adjacent months do not, be suspicious — a real change in the outlook usually shows up across the curve. If several related markets moved together, something happened. If only one moved, it may have been one participant.
Cross-venue is the sharpest version of this check. If Kalshi moves and Polymarket does not, one of them is late, one of them is thin, or the contracts differ. All three are worth knowing. This site watches for exactly that divergence on the gap board.
Looking for a visible cause
Sometimes a price moves before any visible news and the story emerges afterwards; sometimes the story is public first and the price follows. Both patterns exist and both are informative in different ways.
Neither is a trading signal on its own. The useful question is narrower: did this move have a visible cause, and if not, is the absence of one telling you the market is thin rather than informed? A move nobody can explain on a market nobody is trading is usually the second thing. Thin market warning signs is the check.
A short checklist for any move
- How big is it relative to this market's normal range?
- Did volume come with it?
- Did related markets move?
- Did the other venue move?
- Is there news, and does the news actually bear on the resolution rule?
Five questions, most of them answerable in under a minute, and together they filter out almost everything that is not worth your attention.
Next
Percentage points versus percent fixes the most common way people garble the size of a move when describing it.
Educational content only. Nothing here is financial advice, a solicitation, or an offer to trade. Prediction markets can move against you and a position can lose its entire value. Where this guide describes a difference between venues it describes a theoretical cross-market edge in observed prices, which is not a profit: fees, spreads, capital lockup, transfer time and differing settlement rules all come out of it first.
Keep reading
 Prices and Probability · 4 min readWhat Implied Probability Does Not Tell YouA market price is a probability weighted by money, not by knowledge. The difference explains most of the cases where a confident price turns out to be wrong.
 Prices and Probability · 3 min readPercentage Points vs Percent, and Why It MattersA move from 2% to 3% is one percentage point and a fifty percent increase. Confusing the two produces headlines that are technically true and completely useless.
 Prices and Probability · 4 min readTurning a Price in Cents into a ProbabilityThe conversion is division by one hundred, which is the easy part. The useful part is knowing what the resulting number does and does not claim about the world.
 Kalshi · 3 min readOrder Types on Kalshi and When to Use EachLimit, market, resting and immediate. A short guide to expressing a view on an event exchange without paying more than the view is worth.