Calibration Curves and How to Read Your Own
A calibrated forecaster is right 70% of the time when they say 70%. Building the curve, reading its shape, and what each kind of deviation tells you.
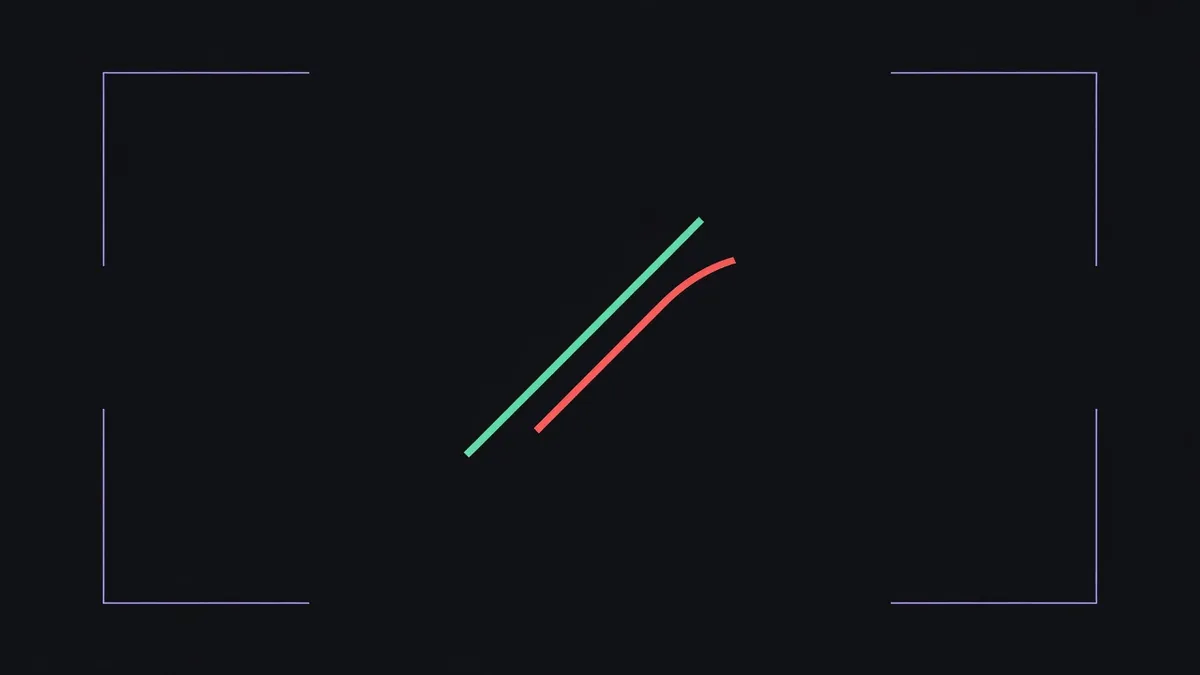
Calibration is the most checkable property a forecaster has. It asks a simple question: when you say 70%, does the thing happen about 70% of the time?
It is not the same as being accurate, and the distinction matters.
Building the curve
Collect your forecasts with their outcomes. You need the probability you gave and whether the thing happened. Nothing else.
Bucket them. Ten buckets works: 0–10%, 10–20%, and so on.
For each bucket, compute two numbers. The average probability you assigned, and the fraction that actually happened.
Plot one against the other. Perfect calibration is the diagonal.
You need a reasonable number of forecasts per bucket for this to mean anything — a bucket with four forecasts tells you nothing. A few hundred forecasts total is where the picture starts to stabilise. Luck versus skill in small samples is about not over-reading an early curve.
Reading the shape
Above the diagonal at the low end, below at the high end. You are underconfident. Your 20% forecasts happen 30% of the time and your 80% forecasts happen 70% of the time. You are hedging toward the middle. The fix is to push your numbers outward when you have actual reasons.
Below at the low end, above at the high end. You are overconfident — the common case. Your 90% forecasts happen 75% of the time. The fix is to stop saying 95% unless you can articulate what would have to go wrong.
A consistent vertical offset. Systematic bias. You say 60% where you should say 45%, everywhere. Easy to correct once you can see it, and invisible without the curve.
Wiggle with no pattern. Usually not enough data.
Calibration is not everything
A forecaster who says 50% on every question is perfectly calibrated and useless. Calibration says your numbers mean what they claim; it says nothing about whether they are informative.
The other half is resolution: how far from the base rate you are willing to go, and how often you are right when you go there. Both matter, and proper scoring rules measure them together. The Brier score and log scoring are the two standard ways.

Calibrating against markets
A useful variant. Instead of scoring your forecasts against outcomes, compare them against the market price at the time you made them.
If you are consistently above the market on things that then happen, and below on things that do not, you have genuine information. If your deviations from the market are uncorrelated with outcomes, you have noise dressed as insight. That second finding is far more common and far more useful to discover early.
It also takes much less data than outcome calibration, because every market gives you a comparison immediately rather than after the event.
Markets have calibration curves too
Aggregate market prices against realised outcomes and you can plot the same curve for a venue. Published studies of this generally find prediction markets reasonably well calibrated in the middle and slightly off at the extremes, with long shots overpriced. The favourite-longshot bias is that deviation.
Knowing the market's own curve tells you where its numbers can be taken at face value and where they need a mental correction.
Getting started
You cannot build a curve without records. Start writing forecasts down today, with the date, the probability and the reason. In six months you will have something to plot. Keeping a forecast journal is how.
Next
Educational content only. Nothing here is financial advice, a solicitation, or an offer to trade. Prediction markets can move against you and a position can lose its entire value. Where this guide describes a difference between venues it describes a theoretical cross-market edge in observed prices, which is not a profit: fees, spreads, capital lockup, transfer time and differing settlement rules all come out of it first.
Keep reading
 Forecasting and Calibration · 3 min readStart With the Base Rate, AlwaysThe single highest-return forecasting habit is asking how often this kind of thing usually happens before thinking about this particular case.
 Forecasting and Calibration · 3 min readKeeping a Forecast Journal That Is Actually UsefulMost forecasting improvement comes from records, not from cleverness. What to write down, what to leave out, and how to review it without flattering yourself.
 Forecasting and Calibration · 3 min readWhere the Wisdom of Crowds Runs OutAggregated opinion beats most individuals most of the time. The conditions it depends on are specific, and prediction markets sometimes fail to meet them.
 Polymarket · 3 min readThings That Surprise People on PolymarketWording that decides outcomes, capital stuck after the event is over, and the security rules that are absolute. The catch-out list in one place.